3QFY2019 Result Update | Pharmaceutical
February 13, 2019
Sun Pharma
NEUTRAL
CMP
`428
Performance Highlights
Target Price
-
% chg
(` cr)
3QFY2019 2QFY2019
% chg (qoq) 3QFY2018
Investment Period
12 months
(yoy)
Net sales
7,657
6,846
11.8
6,598
16.0
Other income
277
442
(37.5)
184
50.1
Sector
Pharmaceutical
Gross profit
5,491
5,089
7.9
4,498
22.1
Market Cap (` cr)
102,739
Operating profit
2,070
1,440
43.7
1,398
48.0
Net Debt (` cr)
(6,687)
Adj. Net profit
1,242
947
31.2
322
286.2
Beta
0.8
Source: Company, Angel Research
52 Week High / Low
679/375
For 3QFY2019, Sun Pharma posted robust numbers. For the quarter, the sales came in at
Avg. Daily Volume
186,302
`7,657cr v/s. `6,598cr in 3QFY2018, registering a yoy growth of 16.0%. India sales at
Face Value (`)
1
`2,235cr, were up by 7%, while US finished dosage sales at US$362mn up 10% yoy V/s
BSE Sensex
36,395
3QFY2018. On the OPM front, the gross margins came in at 71.7% v/s. 68.2% in
Nifty
10,889
3QFY2018, which lead the EBDITA margins to come in at 27.0% v/s. 21.2% in 3QFY2018.
Reuters Code
SUN.BO
This along with a 63.8% yoy dip in tax expenses led the Adj. net profit to come in at
Bloomberg Code
SUNP@IN
`1,242cr v/s. `322cr in 3QFY2018, a yoy growth of 286.2%. We maintain our Neutral.
Results better on all fronts: For 3QFY2019, Sun Pharma posted robust numbers. For the
Shareholding Pattern (%)
quarter, the sales came in at `7,657cr v/s. `6,598cr in 3QFY2018, registering a yoy growth
Promoters
54.4
of 16.0%. India sales at `2,235cr, were up by 7%, while US finished dosage sales at
MF / Banks / Indian Fls
15.2
US$362mn up 10% yoy V/s 3QFY2018. On the OPM front, the gross margins came in at
FII / NRIs / OCBs
21.6
71.7% v/s. 68.2% in 3QFY2018, which lead the EBDITA margins to come in at 27.0% v/s.
Indian Public / Others
8.8
21.2% in 3QFY2018. This along with a 63.8% yoy dip in tax expenses led the Adj. net profit
to come in at `1,242cr v/s. `322cr in 3QFY2018, a yoy growth of 286.2%. Consolidated
Abs. (%)
3m 1yr
3yr
R&D expense for 3QFY2019 was ` 465cr, or 6.1% of sales compared to `473cr or 7.2% of
Sensex
0.4
28.4
58.6
sales for 3QFY2018.
Sun Pharma
(6.0)
(34.6)
(48.5)
Outlook and valuation: Sun Pharma is expected to post net sales CAGR of 12.1%, while
EPS will post a CAGR of ~27% during FY2018-21E. The growth would be mainly driven by
improved product mix. However, given the concerns on corporate governance and risk-
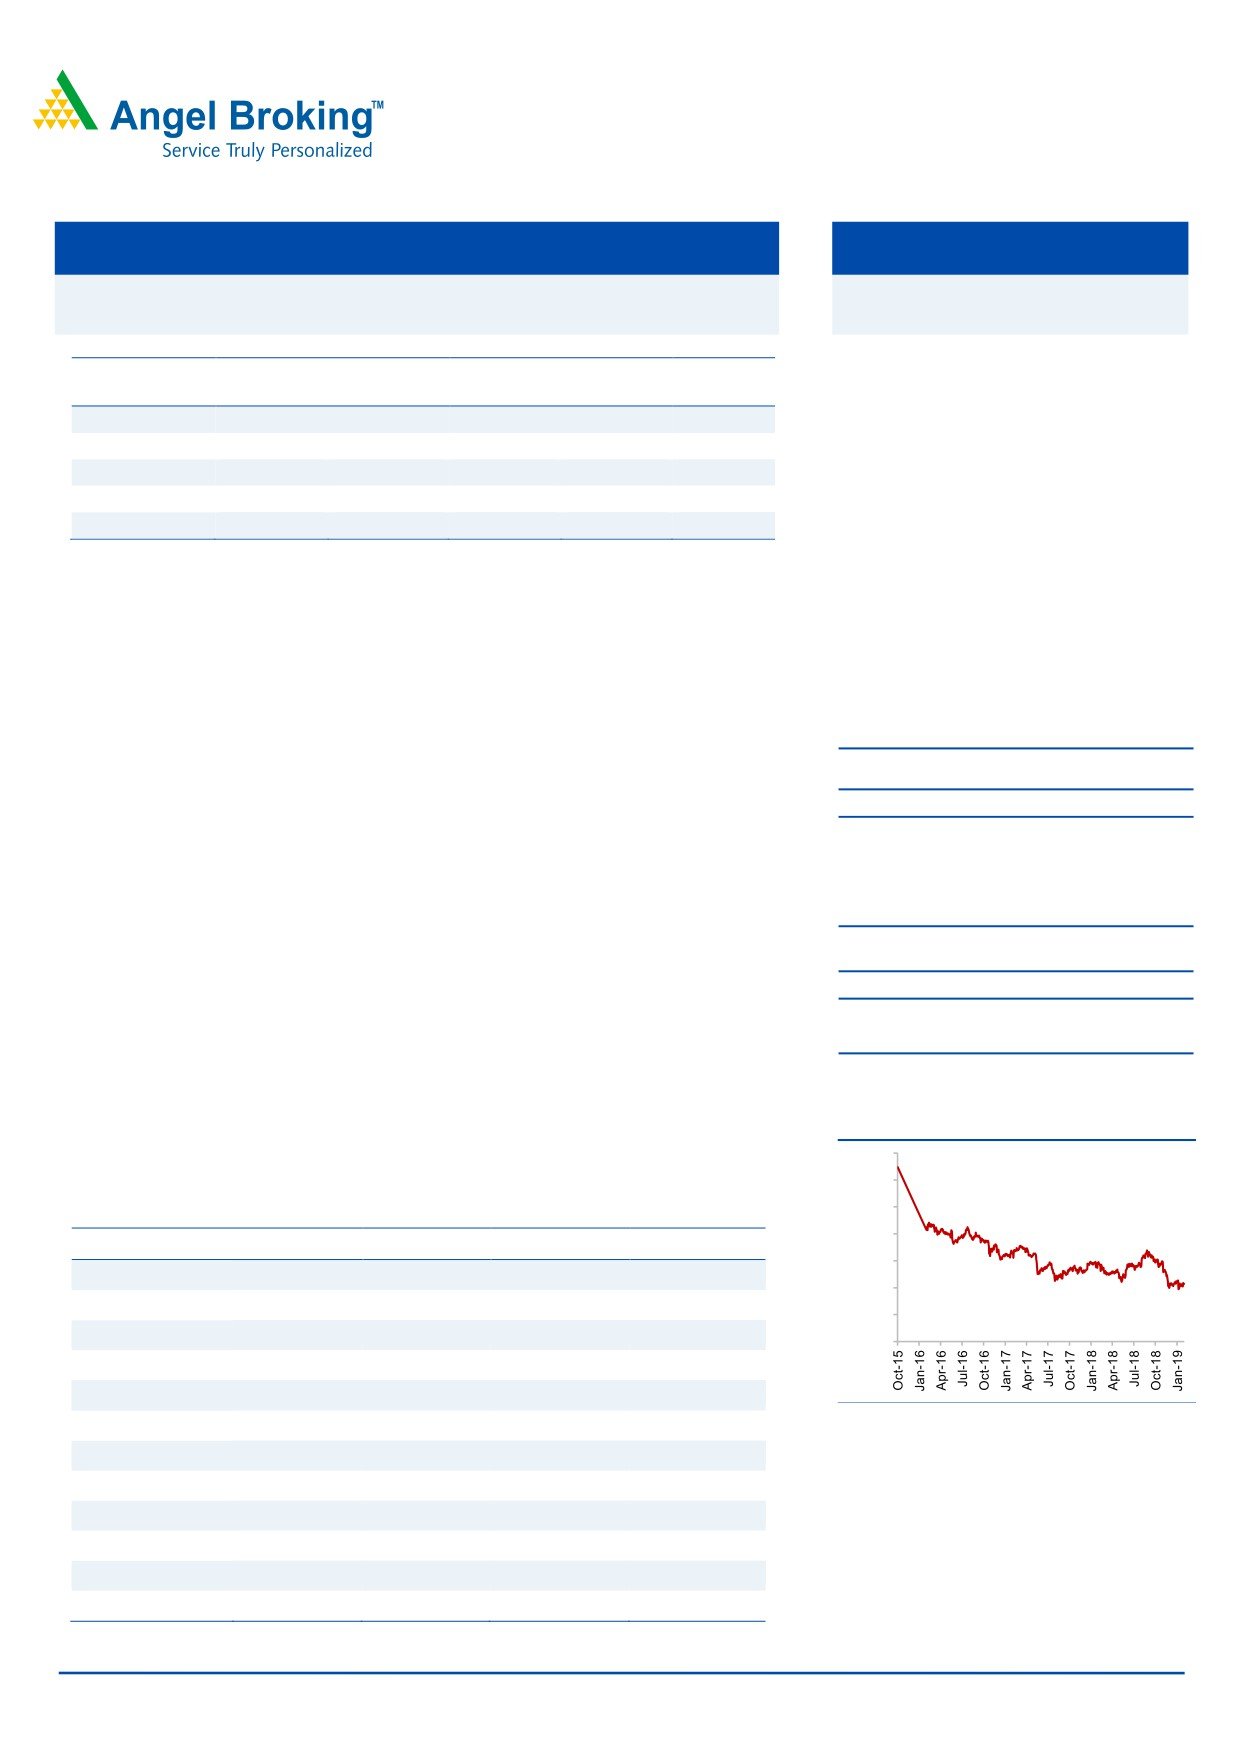
3-year price chart
reward, we remain Neutral. Also, current valuations capturer the best-case scenario for
1,400
the company.
1,200
1,000
Key financials (Consolidated)
800
Y/E March (` cr)
FY2018
FY2019E
FY2020E
FY2021E
600
Net sales
26,489
28,725
32,929
37,340
400
% chg
(16.1)
8.4
14.6
13.4
200
Adj. Net profit
2,879
3,737
4,919
5,821
0
% chg
(58.5)
29.8
31.6
18.3
EPS (`)
12.0
15.6
20.5
24.3
Source: Company, Angel Research
EBITDA margin (%)
17.6
23.0
24.5
24.3
P/E (x)
35.7
27.5
20.9
17.6
RoE (%)
8.8
10.3
12.3
13.5
RoCE (%)
6.6
9.6
11.5
12.0
Sarabjit Kour Nangra
P/BV (x)
2.7
2.6
2.4
2.1
+91 22 39357600 Ext: 6806
EV/Sales (x)
3.6
3.3
2.8
2.4
EV/EBITDA (x)
20.7
14.6
11.5
9.8
Source: Company, Angel Research; Note: CMP as of February 11, 2019
Please refer to important disclosures at the end of this report
1
Sun Pharma | 3QFY2019 Result Update
Exhibit 1: 3QFY2019 performance (Consolidated)
Y/E March (` cr)
3QFY2019
2QFY2019
% chg QoQ 3QFY2018
% chg yoy 9MFY2019 9MFY2018
% chg
Net sales
7,657
6,846
11.8
6,598
16.0
21,642
19,355
11.8
Other income
276.5
442.3
(37.5)
184.2
50.1
1,004
693
44.8
Total income
7,933
7,289
8.8
6,782
17.0
22,646
20,048
13.0
Gross profit
5,491
5,089
7.9
4,498
22.1
15,612
13,700
14.0
Gross margin (%)
71.7
74.3
68.2
72.1
70.8
Operating profit
2,070
1,440
43.7
1,398
48.0
5,031
3,767
33.5
Operating margin (%)
27.0
21.0
21.2
23.2
19.5
Interest
145
130
11.8
95
51.9
405
362
11.9
Depreciation
471
427
10.4
339
38.8
1,299
1,045
24.4
Extraordinary item loss/ ( gain)
0
1,214
0
1,214
951
PBT
1,730
1,326
30.5
1,148
50.7
4,330
3,054
41.8
Provision for taxation
270.9
269.7
0.5
748.7
(63.8)
630
1,121
(43.8)
PAT before extra-ordinary item
1,459
1,057
38.1
356
309.5
3,701
1,933
91.5
Minority interest(MI)
219
110
99.3
35
(459)
(229)
Adj. PAT
1,242
947
31.2
322
286.2
3,242
1,704
90.3
Reported PAT
1,242
(270)
-
322
286.2
2,028
753
169.2
Adj. EPS (`)
5.2
3.9
1.3
13.5
7.1
Source: Company, Angel Research
Sales improve sequentially: For 3QFY2019, the company posted robust
numbers. . For the quarter, the sales came in at `7,657cr v/s. `6,598cr in 3QFY2018,
registering a yoy growth of 16.0%. India sales at `2,235cr, were up by 7%, while US
finished dosage sales at US$362mn up 10% yoy V/s 3QFY2018.
Sales in the US were US$362mn for the quarter, a growth of 10% over same
period last year and accounted for 34% of total sales. For nine-month period,
sales were US$1,083mn recording a growth of 10% over same period last year. At
the same time, Taro posted 3QFY2019 sales of US$176mn, up 13% over
3QFY2018. For the nine month, sales were US$490mn, marginally up over nine-
month last year. Taro’s net profit for 3QFY3019 was US$93mn while for the nine-
month period; it reported a net profit of US$223mn. The company had 441
ANDAs filed with the USFDA. Currently, ANDAs for 123 products await USFDA
approval, including 15 tentative approvals.
Sale of branded formulations in India for 3QFY2019 was `2,235cr, up by 7% and
accounting for 29% of total sales. For the nine month, sales were at `6,247cr, up
by 3% over same period last year. Sun Pharma is ranked No. 1 and holds
approximately 8.2% market share in the over `129,000cr Indian pharmaceutical
market as per AIOCD AWACS December-2018 report. For 3QFY2019, the
company launched 20 new products in the Indian market.
Sales in emerging markets were at US$203mn for 3QFY3019; up 7% over same
quarter last year and accounted for 19% of total sales. For the nine month, sales
were at US$594mn, up by 8% yoy over the nine-month period last year.
Formulation sales in Rest of World (ROW) markets excluding US & Emerging
Markets were US$125mn in 3QFY2019, a growth of 4% over 3QFY2018 &
February 13, 2019
2
Sun Pharma | 3QFY2019 Result Update
accounting for approximately 12% of revenues. For the nine month, sales were
US$340mn, down 2% over nine-month last year.
API business imparts benefits of vertical integration for our formulations business.
We continue to increase the API supply for captive consumption for key products.
For Q3FY19, external sales of API were at `426cr, up by 15% over 3QFY2018. For
the nine month, API sales were at `1,247cr, up by 17% over nine-month in FY2018.
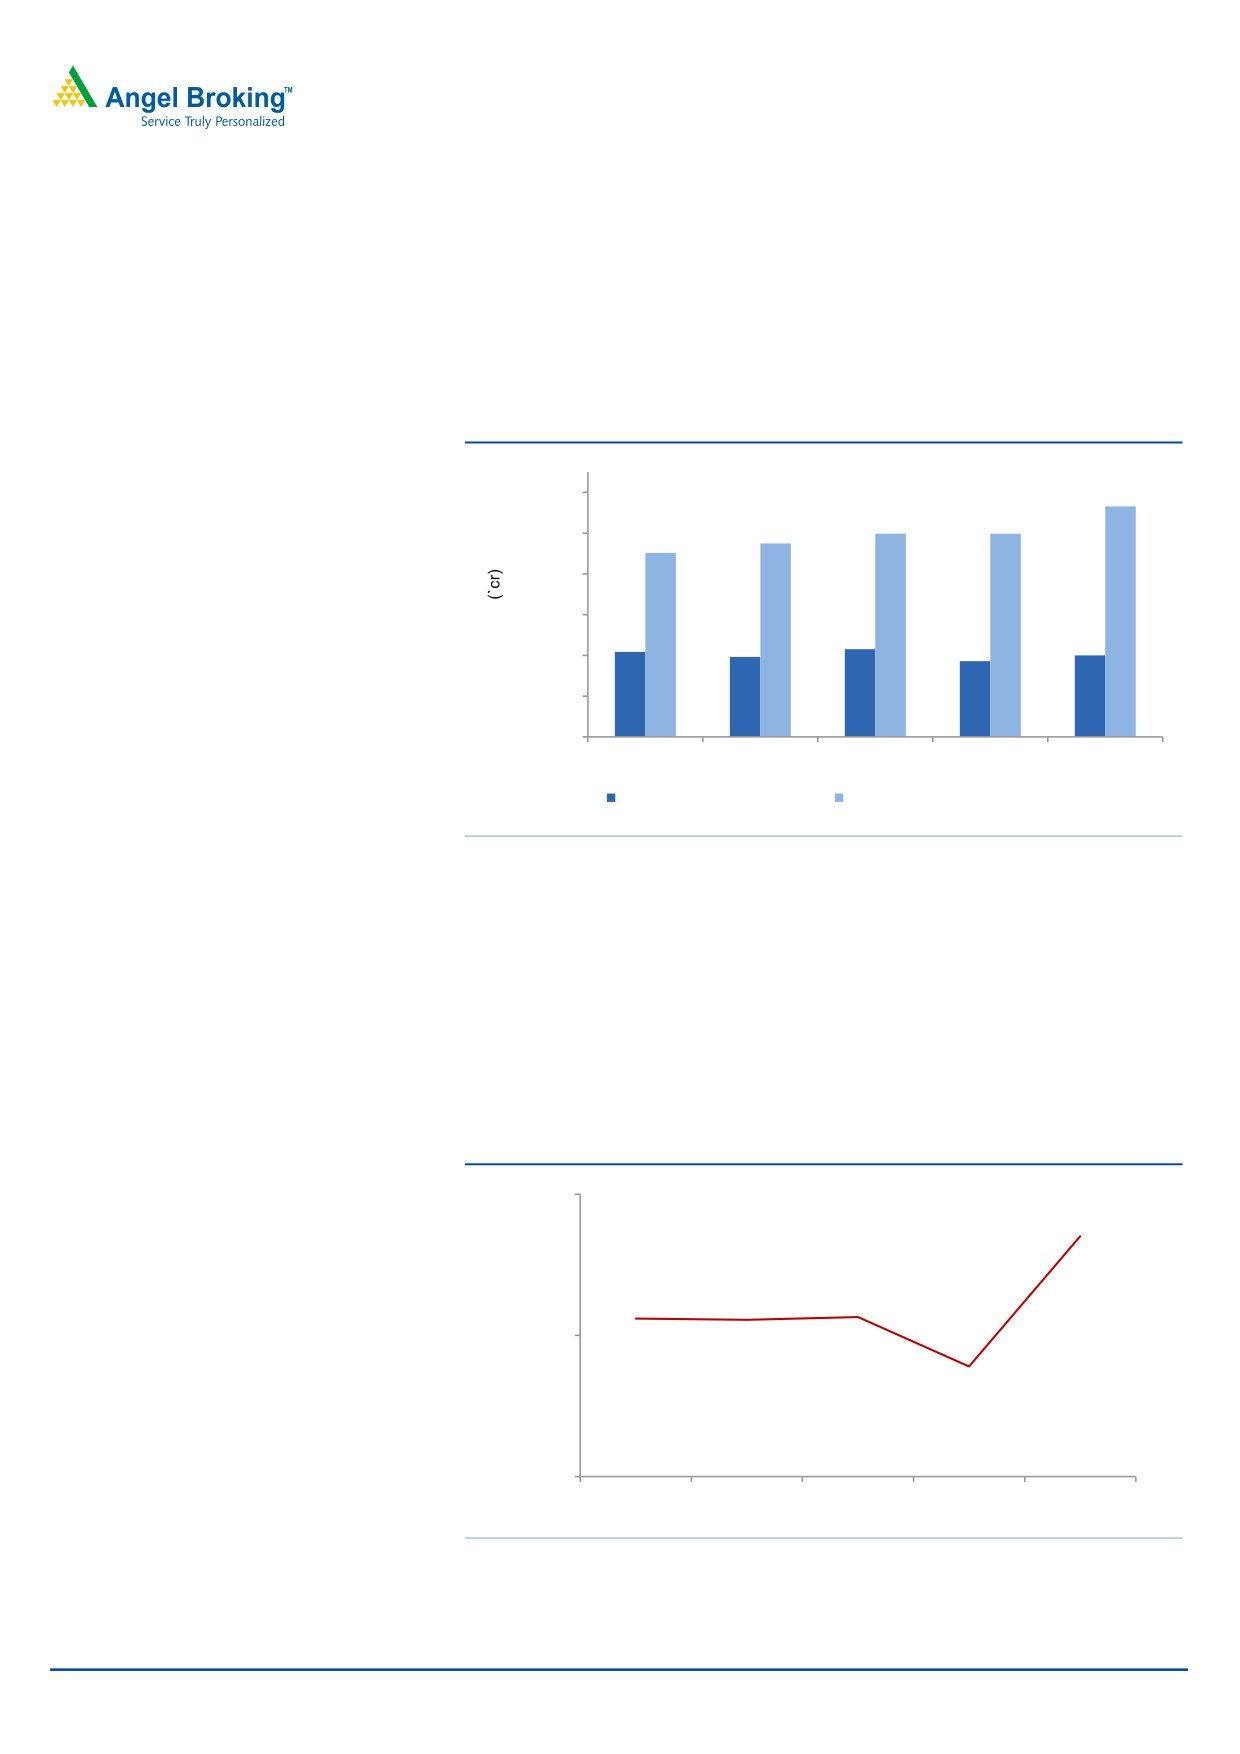
Exhibit 2: Sales trend
5657
6000
4987
4987
4513
4748
5000
4000
3000
2085
2152
1963
2000
1860
2000
1000
0
3QFY2018
4QFY2018
1QFY2019
2QFY2019
3QFY2019
Domestic Formulation
Export Formulation, Bulk and others
Source: Company, Angel Research
OPM at 27.0%, qoq higher than 17.8% in 2QFY2018: On the OPM front, the
gross margins came in at 71.7% v/s. 68.2% in 3QFY2018, which lead the EBDITA
margins to come in at 27.0% v/s. 21.2% in 3QFY2018. This mainly came in on back
of gross margin expansion (which improved on back of improved product mix)
along with a 2.1% yoy dip in the SG&A expenses. Consolidated R&D expense for
3QFY2019 was ` 465cr, or 6.1% of sales compared to `473cr or 7.2% of sales for
3QFY2018. For the nine month, R&D expense was `1,417cr’ or 6.5% of sales.
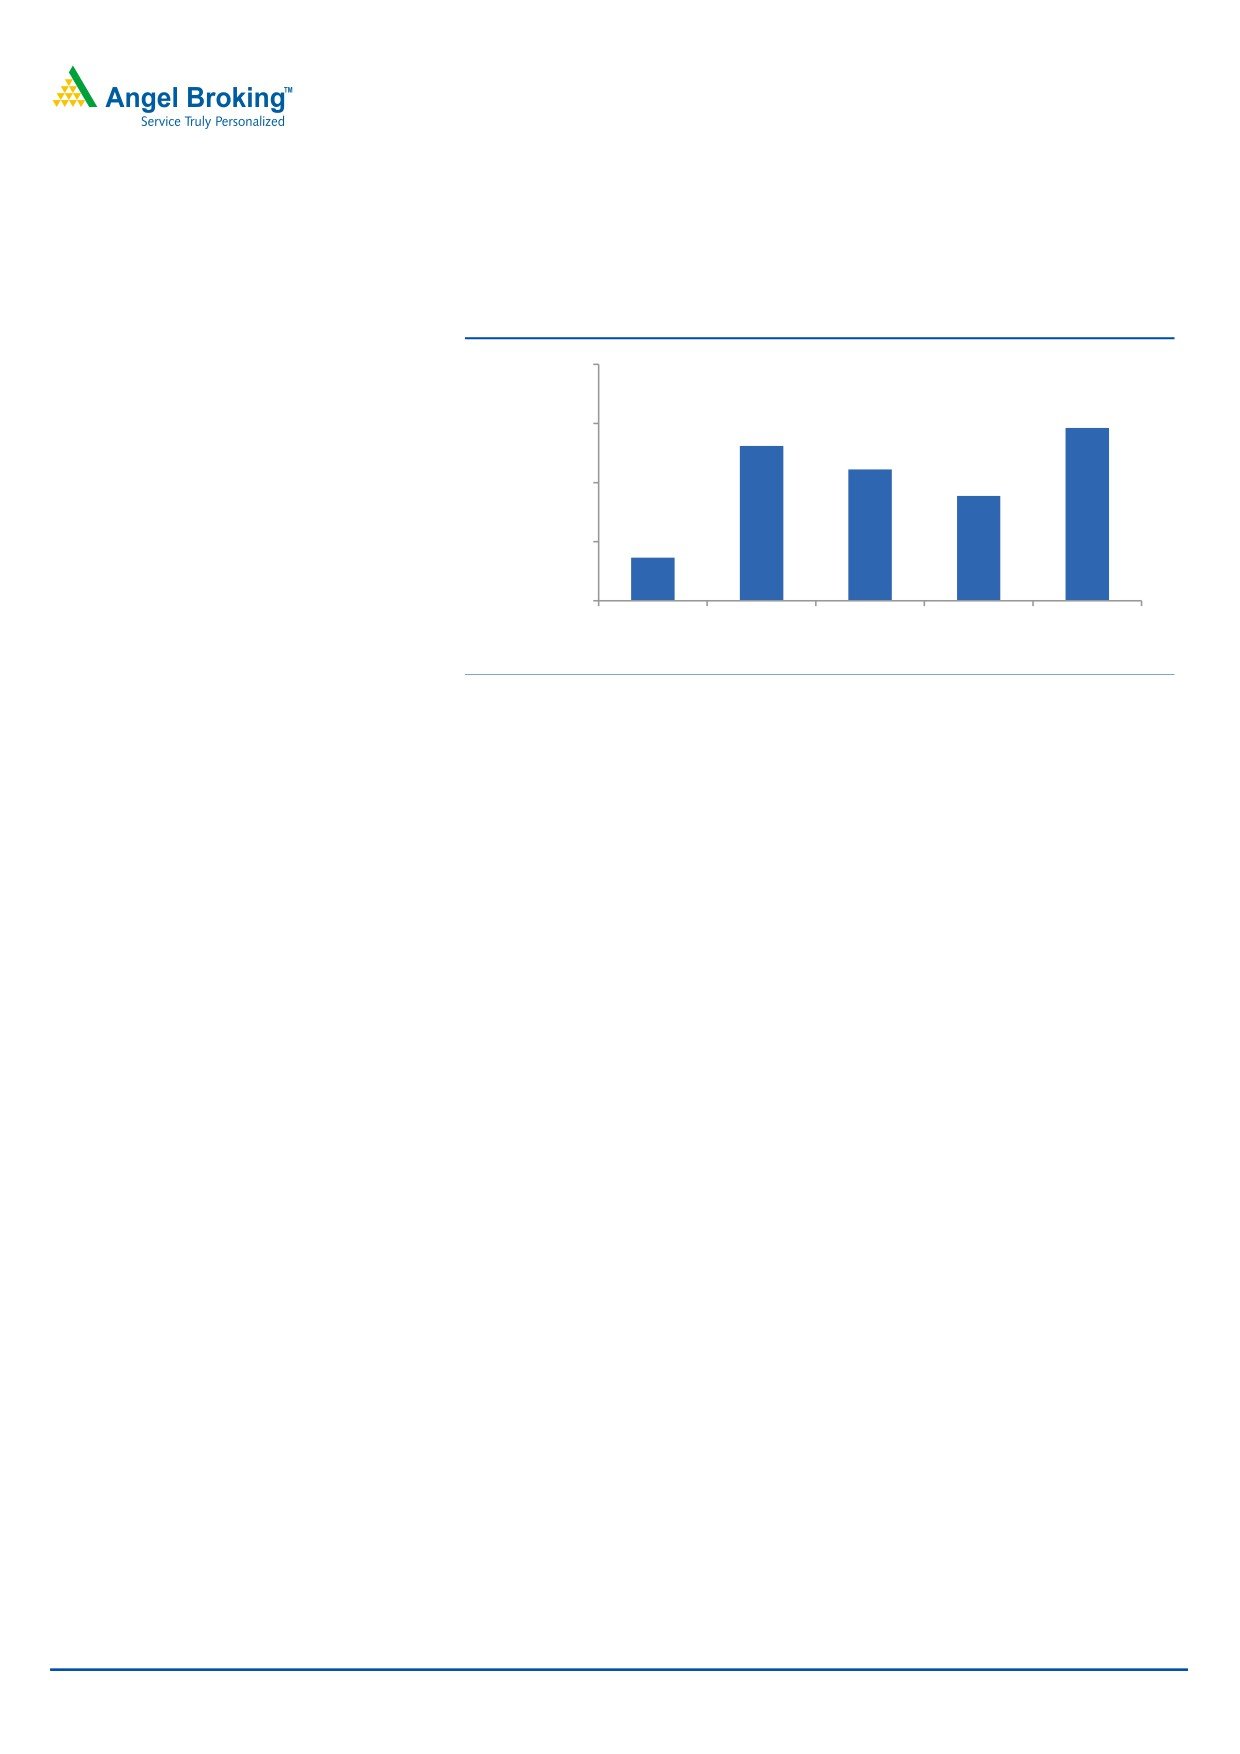
Exhibit 3: OPM trend (percentage)
30.0
27.0
21.3
21.2
21.1
20.0
17.8
10.0
3QFY2018
4QFY2018
1QFY2019
2QFY2019
3QFY2019
Source: Company, Angel Research,
Net profit slightly better on back of low taxes: OPM expansion aided along
with a 63.8% yoy dip in tax expenses led the Adj. net profit to come in at `1,461cr
February 13, 2019
3
Sun Pharma | 3QFY2019 Result Update
v/s. `364cr in 3QFY2018, a yoy growth of 300.9%. In addition, there was a 50.1%
yoy rise in other income.
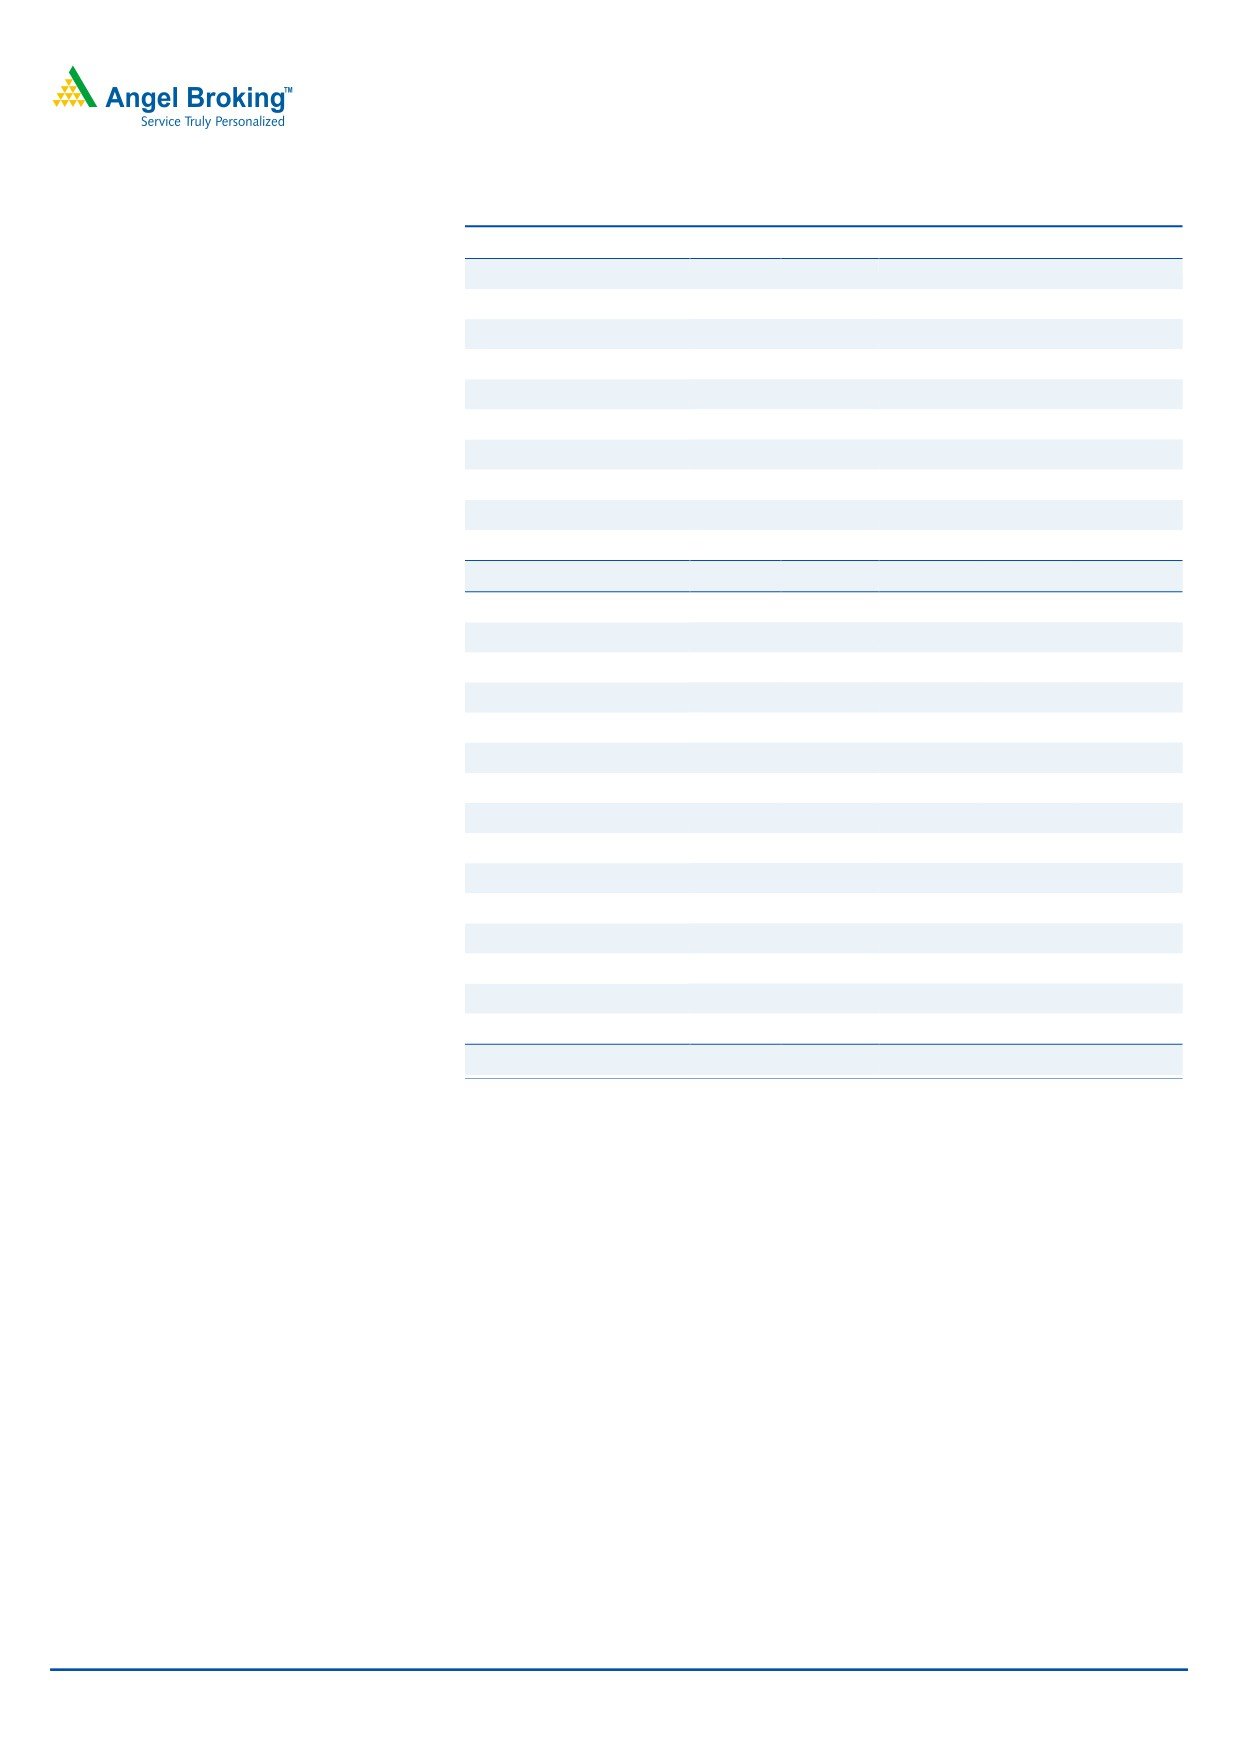
Exhibit 4: Adjusted Net profit trend (` cr)
2,000
1,461
1,500
1,309
1,111
1,000
887
500
365
0
3QFY2018
4QFY2018
1QFY2019
2QFY2019
3QFY2019
Source: Company, Angel Research
Concall Takeaways
Sun pharma is in the process of transitioning distribution from Aditya
Medisales to wholly owned subsidiary.
On the Atlas transaction, the company has provided loan of US$300mn to
Sun Pharmaceuticals in FY2018 as per supply contract terms and conditions,
since the company was unable to fulfill the supply obligation due to GMP
issues at Halol. On the loan of US$300mn, Sun Pharmaceuticals, guided that it
will unwind the transaction, which will result in assignment of supply contract
to one of wholly owned subsidiary and Atlas moving out of the transaction.
Hence, on a consolidated basis in FY2019, US$300mn loan will be squared off
against unfulfilled supply obligation.
In the domestic business, covered market of Sun Pharmaceuticals is growing
at ~11% yoy.
Investment arguments
Strong ANDA pipeline; with specialty products to gain strength: Sun
Pharma, in terms of ANDAs, cumulatively has 441 products, out of which 123
products now await USFDA approval, including 15 tentative approvals. With the
merger of Ranbaxy Laboratories, the company is now the fifth-largest specialty
generics company in the world (behind Teva, Sandoz, Activas and Mylan). Apart
from the generic product portfolio, the company is also developing specialty
product portfolio. During FY2018, the specialty product business grossed sales of
~US$300mn constituting around 24-25% of US sales. Currently only Absorica
drives the sales and DUSA acquired products.
Going forward, the sales will be driven by products acquired or in-licensed by the
company; namely- Ilumya, Cequa, Yonsa, & Xelpros. These products will drive
growth of the US sales of the company mainly from FY2020-21E. Overall, we
expect the region to post a CAGR of 14.0% in sales over FY2018-21E, accounting
for almost ~35% of the overall sales in FY2021E.
February 13, 2019
4
Sun Pharma | 3QFY2019 Result Update
Domestic business: Sun Pharma’s domestic formulation business is among the
fastest growing in the Indian pharmaceutical industry. It contributed 23% to the
company’s total turnover in FY2014. Sun Pharma, with Ranbaxy Laboratories’
merger, is now the segment leader with a market share of 8.3% in the domestic
formulation market, followed by Abbott India, which has a market share of 6.3%.
This is a significant gap considering that the segment is highly fragmented.
In addition, the company is market leader in the chronic segments and has a well-
diversified product basket. Top 10 Brands contribute ~17% of India revenues.
Thus, growth is driven by a basket of brands, a very low product concentration. In
addition, the company has the highest field productivity of around `0.86cr/MR V/s
0.52cr/ MR - which is the industry average. Overall, we expect the domestic
formulation
business
to
post
a
CAGR of
12.3%
over
FY2018-21E, contributing ~30% to the overall formulation sales of the company in
FY2021.
Healthy balance sheet: Sun Pharma has one of the strongest balance sheets in
the sector with cash of ~`10,000cr. The same can continue to support the
Management in inorganic growth and in scouting for acquisitions, especially in
the US and in emerging markets.
Corporate governance issues weighing on the company: During
3QFY2019, various issues related to corporate governances, which mainly were
financial in nature like third party loans, increasing contingent liabilities related to
taxes on balance sheet amongst others. Over, this quarter the company has
committed to clean up the issues two of which prominent are its arrangement
with Aditya Medisales, which was used to distribute the products of the company
and with effect from 1QFY2020, will become its wholly owned subsidiary). The
other one is unwinding the US$345mn loan given to Atlas Global Trading by Sun
Pharmaceuticals against the supply obligation that Sun has on its balance sheet as
liability. The loan was given to Atlas in lieu of Sun Pharma’s inability to supply
certain products due to Halol warning letter. This unwinding will be concluded in
FY2019 itself. While company has clarified these two issues, we still are not
convinced, as there are other issues, which will weigh on its corporate
governance; some of which are still unanswered.
Outlook and valuation: Sun Pharma is expected to post net sales CAGR of
12.1%, while EPS will post a CAGR of ~27% during FY2018-21E. The growth would
be mainly driven by improved product mix. However, given the concerns on
corporate governance and risk-reward, we remain Neutral. Also, current
valuations capturer the best-case scenario for the company.
Company background
Sun Pharma is an international specialty pharma company, with a large presence
in the US and India, and a footprint across other markets. In India and rest of the
world markets, the key chronic therapy areas for the company are cardiology,
psychiatry, neurology, gastroenterology, diabetology, etc. The company is a
market leader in specialty therapy areas in India. In India, the company has
emerged as a leading pharma company, where it is the first leading player. In
addition, in the US, a key geography, the company has expanded significantly
through both in-organic and organic routes.
February 13, 2019
5
Sun Pharma | 3QFY2019 Result Update
Profit & Loss statement (Consolidated)
Y/E March (` cr)
FY2017
FY2018
FY2019E FY2020E FY2021E
Gross sales
31,850
26,746
29,010
33,251
37,707
Less: Excise duty
272
257
285
322
367
Net sales
31,578
26,489
28,725
32,929
37,340
Other operating income
160
132
132
132
132
Total operating income
31,739
26,622
28,857
33,061
37,472
% chg
10.6
(16.1)
8.4
14.6
13.3
Total expenditure
21,489
21,832
22,132
24,859
28,275
Net raw materials
8,131
7,425
7,756
8,232
8,588
Other mfg costs
1,380
1,157
1,255
1,439
1,631
Personnel
4,902
5,367
5,796
6,956
8,347
Other
7,076
7,883
7,287
8,517
9,654
EBITDA
10,089
4,658
6,593
8,070
9,065
(% of Net Sales)
31.9
17.6
23.0
24.5
24.3
Depreciation & amort.
1,265
1,500
1,764
1,880
1,996
EBIT
8,985
3,290
4,961
6,322
7,202
% chg
(19.9)
(63.4)
50.8
27.4
13.9
(% of Net Sales)
28.5
12.4
17.3
19.2
19.3
Interest & other charges
400
518
612
600
600
Other income
463
707
1,201
1,306
1,554
(% of PBT)
5.1
20.3
21.6
18.6
19.1
Share in profit of Asso.
-
-
-
-
Recurring PBT
9,048
3,479
5,551
7,028
8,156
% chg
-18.0
0.0
0.0
0.0
0.0
Extraordinary expense/(inc.)
-
(720)
1,214
-
1.0
PBT (reported)
9,048
3,479
4,337
7,028
8,155
Tax
1,211.6
845.2
867.3
1,405.7
1,630.9
(% of PBT)
13.4
24.3
20.0
20.0
20.0
PAT (reported)
7,836
2,634
3,469
5,623
6,524
Add: Share of earnings of asso.
10
(25)
(25)
(25)
(24)
Less: Minority interest (MI)
882
447
678
678
678
Prior period items
-
-
-
-
PAT after MI (reported)
6,964
2,162
2,766
4,919
5,821
ADJ. PAT
6,932
2,879
3,737
4,919
5,821
% chg
46.2
(69.0)
27.9
77.9
18.3
(% of Net Sales)
1.0
2.0
3.0
4.0
5.0
Basic EPS (`)
28.9
12.0
15.6
20.5
24.3
Fully Diluted EPS (`)
28.9
12.0
15.6
20.5
24.3
% chg
26.2
(58.5)
29.8
31.6
18.3
February 13, 2019
6
Sun Pharma | 3QFY2019 Result Update
Balance Sheet (Consolidated)
Y/E March (` cr)
FY2017
FY2018
FY2019E FY2020E FY2021E
SOURCES OF FUNDS
Equity share capital
240
240
240
240
240
Preference capital
Reserves & surplus
36,400
37,861
39,504
43,300
47,998
Shareholders’ funds
36,640
38,101
39,744
43,540
48,238
Minority interest
3,791
3,884
4,562
5,240
5,918
Total loans
9,832
10,385
10,000
10,000
10,000
Deferred tax liability
(2,178)
(1,975)
(1,975)
(1,975)
(1,975)
Other Long Term Liabilities
-
-
-
-
Long Term Provisions
1,342
463
443
497
565
Total liabilities
49,426
50,858
52,774
57,303
62,747
APPLICATION OF FUNDS
Gross block
13,399
14,876
16,876
18,876
20,876
Less: Acc. depreciation
6,791
8,096
9,860
11,740
13,736
Net block
6,608
6,780
7,016
7,136
7,140
Capital work-in-progress
2,801
2,465
2,465
2,465
2,465
Goodwill
5,537
5,607
5,607
5,607
5,607
Investments
5,531
6,466
6,466
6,466
6,466
Long term long & adv.
1,192
7,143
7,507
7,417
7,713
Current assets
4,526
6,103
6,375
6,767
7,059
Cash
32,723
27,545
28,743
34,256
40,869
Loans & advances
15,141
9,929
9,731
12,662
16,610
Other
2,480
2,265
2,366
2,511
2,620
Current liabilities
15,102
15,351
16,647
19,083
21,639
Net current assets
9,491
11,251
11,406
12,811
14,572
Others
23,231
16,294
17,338
21,445
26,297
Total assets
49,426
50,858
52,774
57,303
62,747
February 13, 2019
7
Sun Pharma | 3QFY2019 Result Update
Cash Flow Statement (Consolidated)
Y/E March (` cr)
FY2017
FY2018
FY2019E FY2020E FY2021E
Profit before tax
9,048
3,479
5,551
7,028
8,156
Depreciation
1,265
1,500
1,764
1,880
1,996
(Inc.)/Dec in working capital
(1,600)
(12,467)
(2,417)
(2,933)
(4,279)
Direct taxes paid
1,212
845
867
1,406
1,631
Cash Flow from Operations
7,502
(8,333)
4,030
4,570
4,242
(Inc.)/Dec.in Fixed Assets
(80)
(1,141)
(2,000)
(2,000)
(2,000)
(Inc.)/Dec. in Investments
1,524
(5,951)
(364)
90
(296)
Other income
-
-
-
-
-
Cash Flow from Investing
1,444
(7,092)
(2,364)
(1,910)
(2,296)
Issue of Equity
-
-
-
-
-
Inc./(Dec.) in loans
(2,214)
(1,433)
365
55
68
Dividend Paid (Incl. Tax)
(1,123)
(1,123)
(1,123)
(1,123)
(1,123)
Others
(3,650)
12,770
(1,106)
1,339
3,057
Cash Flow from Financing
(6,986)
10,215
(1,864)
271
2,002
Inc./(Dec.) in Cash
1,959
(5,211)
(198)
2,931
3,948
Opening Cash balances
13,182
15,141
9,929
9,731
12,662
Closing Cash balances
15,141
9,929
9,731
12,662
16,610
February 13, 2019
8
Sun Pharma | 3QFY2019 Result Update
Key Ratios
Y/E March
FY2017
FY2018
FY2019E FY2020E FY2021E
Valuation Ratio (x)
P/E (on FDEPS)
14.8
35.7
27.5
20.9
17.6
P/CEPS
12.5
28.1
22.7
15.1
13.1
P/BV
2.8
2.7
2.6
2.4
2.1
Dividend yield (%)
0.8
0.5
0.5
0.5
0.5
EV/Sales
3.1
3.6
3.3
2.8
2.4
EV/EBITDA
9.7
20.7
14.6
11.5
9.8
EV / Total Assets
2.0
1.9
1.8
1.6
1.4
Per Share Data (`)
EPS (Basic)
28.9
12.0
15.6
20.5
24.3
EPS (fully diluted)
28.9
12.0
15.6
20.5
24.3
Cash EPS
34.3
15.3
18.9
28.3
32.6
DPS
3.5
2.0
2.0
2.0
2.0
Book Value
152.3
158.4
165.2
181.0
200.5
DuPont Analysis
EBIT margin
28.5
12.4
17.3
19.2
19.3
Tax retention ratio
86.6
75.7
80.0
80.0
80.0
Asset turnover (x)
1.0
0.7
0.7
0.8
0.8
ROIC (Post-tax)
25.7
6.7
9.5
11.6
12.7
Cost of Debt (Post Tax)
3.7
7.5
5.3
4.8
4.7
Leverage (x)
0.0
0.0
0.0
0.0
0.0
Operating ROE
25.7
7.9
9.5
11.6
12.7
Returns (%)
ROCE (Pre-tax)
18.6
6.6
9.6
11.5
12.0
Angel ROIC (Pre-tax)
40.1
11.2
14.6
17.7
19.3
ROE
22.4
8.8
10.3
12.3
13.5
Turnover ratios (x)
Asset Turnover (Gross Block)
2.3
1.9
1.8
1.8
1.9
Inventory / Sales (days)
76
94
91
95
100
Receivables (days)
68
96
91
95
100
Payables (days)
74
95
94
94
94
WC cycle (ex-cash) (days)
96
44
101
93
78
Solvency ratios (x)
Net debt to equity
(0.1)
0.0
0.0
(0.1)
(0.1)
Net debt to EBITDA
(0.5)
0.1
0.0
(0.3)
(0.7)
Interest Coverage (EBIT/Int.)
-
-
-
-
-
February 13, 2019
9
Sun Pharma | 3QFY2019 Result Update
Research Team Tel: 022 - 39357800
DISCLAIMER
Angel Broking Limited (hereinafter referred to as “Angel”) is a registered Member of National Stock Exchange of India Limited,
Bombay Stock Exchange Limited, Metropolitan Stock Exchange Limited, Multi Commodity Exchange of India Ltd and National
Commodity & Derivatives Exchange Ltd It is also registered as a Depository Participant with CDSL and Portfolio Manager and
Investment Adviser with SEBI. It also has registration with AMFI as a Mutual Fund Distributor. Angel Broking Limited is a registered
entity with SEBI for Research Analyst in terms of SEBI (Research Analyst) Regulations, 2014 vide registration number INH000000164.
Angel or its associates has not been debarred/ suspended by SEBI or any other regulatory authority for accessing /dealing in
securities Market. Angel or its associates/analyst has not received any compensation / managed or co-managed public offering of
securities of the company covered by Analyst during the past twelve months.
This document is solely for the personal information of the recipient, and must not be singularly used as the basis of any investment
decision. Nothing in this document should be construed as investment or financial advice. Each recipient of this document should
make such investigations as they deem necessary to arrive at an independent evaluation of an investment in the securities of the
companies referred to in this document (including the merits and risks involved), and should consult their own advisors to determine
the merits and risks of such an investment.
Reports based on technical and derivative analysis center on studying charts of a stock's price movement, outstanding positions and
trading volume, as opposed to focusing on a company's fundamentals and, as such, may not match with a report on a company's
fundamentals. Investors are advised to refer the Fundamental and Technical Research Reports available on our website to evaluate
the contrary view, if any
The information in this document has been printed on the basis of publicly available information, internal data and other reliable
sources believed to be true, but we do not represent that it is accurate or complete and it should not be relied on as such, as this
document is for general guidance only. Angel Broking Limited or any of its affiliates/ group companies shall not be in any way
responsible for any loss or damage that may arise to any person from any inadvertent error in the information contained in this
report. Angel Broking Limited has not independently verified all the information contained within this document. Accordingly, we
cannot testify, nor make any representation or warranty, express or implied, to the accuracy, contents or data contained within this
document. While Angel Broking Limited endeavors to update on a reasonable basis the information discussed in this material, there
may be regulatory, compliance, or other reasons that prevent us from doing so.
This document is being supplied to you solely for your information, and its contents, information or data may not be reproduced,
redistributed or passed on, directly or indirectly.
Neither Angel Broking Limited, nor its directors, employees or affiliates shall be liable for any loss or damage that may arise from or
in connection with the use of this information.
Disclosure of Interest Statement
Sun Pharma
1. Financial interest of research analyst or Angel or his Associate or his relative
No
2. Ownership of 1% or more of the stock by research analyst or Angel or associates or
No
relatives
3. Served as an officer, director or employee of the company covered under Research
No
4. Broking relationship with company covered under Research
No
Ratings (Based on expected returns
Buy (> 15%)
Accumulate (5% to 15%)
Neutral (-5 to 5%)
over 12 months investment period):
Reduce (-5% to -15%)
Sell (< -15)
February 13, 2019
10